The value of data observability to the data engineer
Since leaving university, I have always been involved with data, learning so much during my time as an automation engineer and big data engineer working for an automotive tier 1 manufacturing company and as a data architect for an IT consultancy in the SAP and BI domain. And today, I count myself very fortunate to have a job at Kensu that I am truly passionate about. As a Technical Solution Architect, I get to help organizations with data health and data engineering problems on a daily basis!
I remember when I was a data engineer, I would spend an excessive amount of my time trying to troubleshoot and find data issues, which often were several steps away from where I was initially looking. Data pipelines being complex, I would have to trace the data backward through various transformations to find the problem. Sometimes this could get frustrating, and, of course, this was always done after a data health issue had occurred; that is to say, it was always after the event.
One of my greatest pleasures in working life is helping our customers implement Kensu. My role at Kensu allows me to work with their data engineering team to identify how best to set up Kensu and then help them reap the rewards of data observability.
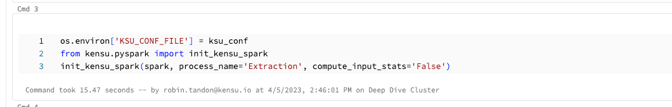
The first thing we do is look at all the data transformation applications, for example, in Databricks or dbt. Then I work with the data engineers to quickly add the three lines of code required to make their applications data observable.
Once applications are data observable, the data engineers can look at setting up the observations and rules in Kensu. This is easy; all they need to do is either execute the data pipeline or connect to the source data and run a scanner or agent. Kensu takes care of the rest.
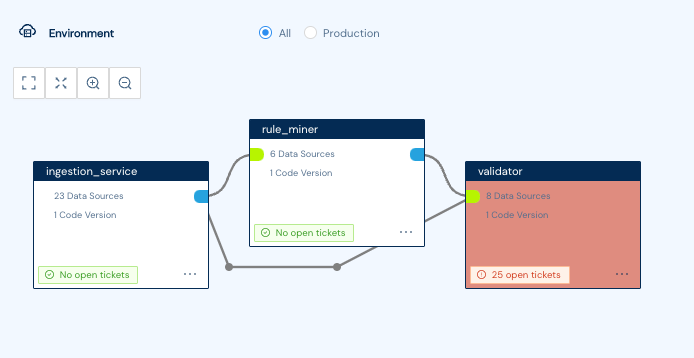
Kensu will build a new project per pipeline and then identify all the applications and their interdependencies.
Kensu, when it observes the pipeline or scans the data source, will look at the metadata and recommend valuable rules to implement.
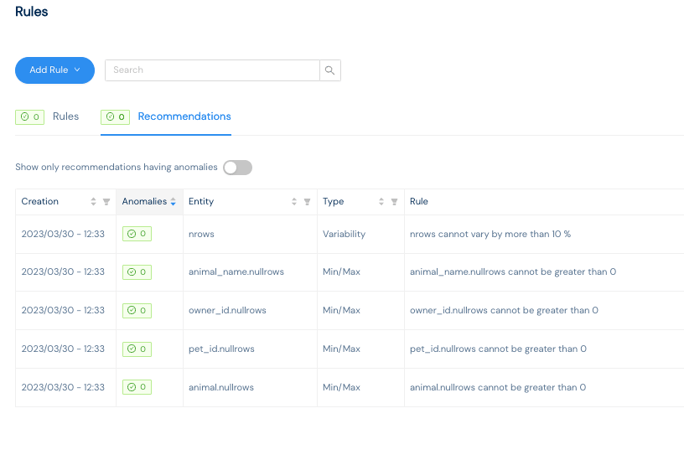
Then, the data engineer can accept, edit or add their own rules.
Once the rules are set up, each time a scan is run or the data pipeline executes, Kensu will check the metadata against them, and if an anomaly is detected, it will provide an alert and create a ticket.
This is where the real value of Kensu kicks in. As a former data engineer, I know a data engineering team can spend too much time finding out about a data health problem only after the issue has propagated through the pipeline and caused havoc. However, with Kensu, as soon as an anomaly is detected, the platform can be set to halt the execution of the pipeline and prevent the propagation of the issue.
So now they have received the alert message, the data engineer can go about troubleshooting in Kensu.
The first thing they will do is either open the ticket in Kensu or click on the ticket in the communication tool they use and were notified from (e.g., Slack, Jira, or Pager Duty). In the ticket, various useful pieces of information are present. These include the project name, application, rule that triggered the ticket, and the data source.
Now that they have all this information, they can easily begin troubleshooting. Usually, they go to the data source and look at the observation that caused the ticket to be raised.
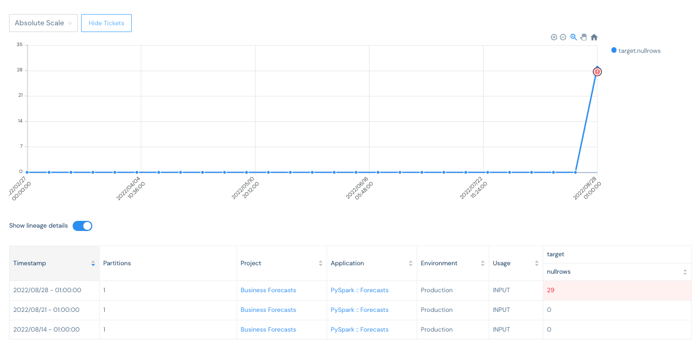
In this case, they will find out that the rule that triggered is the target null rows cannot be greater than zero, and, in this instance, a figure of 29 is noted. So they can next look at the lineage to see where the issue first appears and then fix it.
So as you can see with Kensu, the data engineer can troubleshoot, resolve and prevent data health issues in just a few clicks. This saves him a load of time and helps build trust in the data they provide.
If you want to learn more about Kensu and our platform, please feel free to visit www.kensu.io, where you can access our resources section, arrange a call with one of our experts, or try our solution free of charge.