Apache Spark and Data Observability: a technical deep dive
Apache Spark has become one of the most popular open-source data processing platforms in the enterprise ecosystem, especially thanks to its ability to handle both batch and real-time data processing on large amounts of data. However, working with such a quantity of data also requires a high level of observability to ensure the reliability of the data from collection to storage, including detection of issues, clues about the impact and the causes of those issues, generation of insights about the data and prevention of further issues.
With Kensu, data observability in Spark is achieved through adding a query listener to the Spark session. This will work like an agent ,allowing it to retrieve in background data observations from the application, contextually and synchronously at run time. The agent will collect metadata about the data sources used in the Spark jobs, including the location of the files used and produced, their schema, their lineage inside the application, as well as information about the job itself, like the version running and its code location. Moreover, the Spark Kensu agent will also generate metrics about the data source, gauging the completeness, the timeliness and the distribution of the data.
Kensu makes it easy to implement data observability
With the Kensu Spark open-source library, data observability in Spark is enhanced and allows organisations to gain a deeper understanding of their Spark data processing applications and pipelines. The library is easy to install with just a few technical steps, adding a JAR image to the Spark cluster and initializing the client using the Kensu py library. These simple steps will activate the logging of data observations which will be sent through the Kensu API to our platform. Let’s see the information sent by the Kensu Spark agent.Example of Spark observations
First observations sent to the Kensu API are the contextual pieces of information, setting up the scene for your data transformation. The context is made of:- The project: business purpose of a set of applications
- The application: here the spark job name, its version and code base location
- Other run information such as the execution environment and the latest execution time.
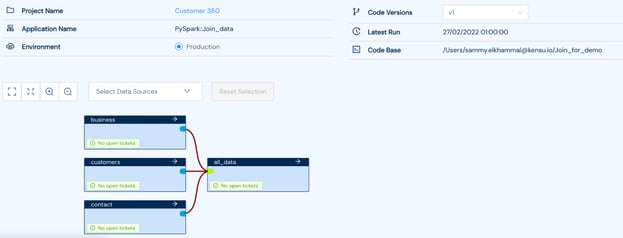
Lineage inside the application page
The data sources used in the spark job are mapped in a lineage graph. You can see here that 3 data sources were used in the Join_data application in order to create the all_data dataset. Moreover, metrics about this data source has been collected:
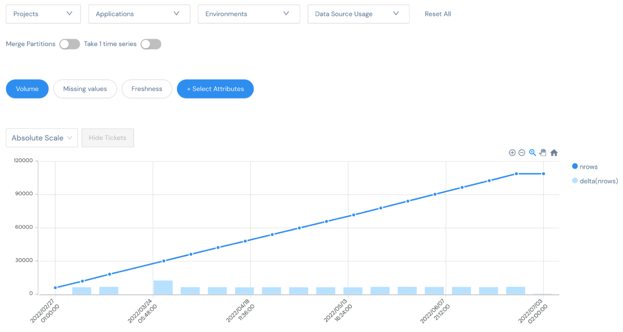
Kensu agent automatically collects completeness information
Continuous validation with Spark and Kensu
Kensu offers brand-new capabilities to avoid Garbage in/Garbage out, by introducing circuit breaker. A circuit breaker is activated when a rule is triggered by an exception observed in the running of a Spark job. The rules are data quality rules which create a ticket each time the agent sends an observation that violates the constraint.
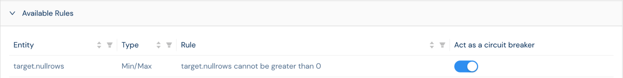
Activation of a rule as a circuit breaker
Thanks to the Kensu API, the spark agent will communicate with the instance, and in case a rule triggered a ticket, will automatically stop the pipeline, avoiding the replication of the error downstream, as well as the use of costly resources to generate rubbish.
To sum up, the Kensu Spark agent is an open-source library that enhances data observability in Spark, making it easy for organizations to gain a deeper understanding of their Spark data processing applications and pipelines. The library is easy to install with just a few technical steps, adding a JAR image to the Spark cluster and initializing the client using the Kensu py library. Kensu also offers circuit breaker rules that trigger an exception in the code based on data quality rules.
If you want to experience the Spark agent by yourself, check our our Free Trial. You can also watch our webinar replay and discover how to monitor the health of a data pipeline within Spark when jobs are running, so you get immediate observability.