


With Kensu, a single engineer can solve data problems that currently take a full team weeks—in less than an hour.
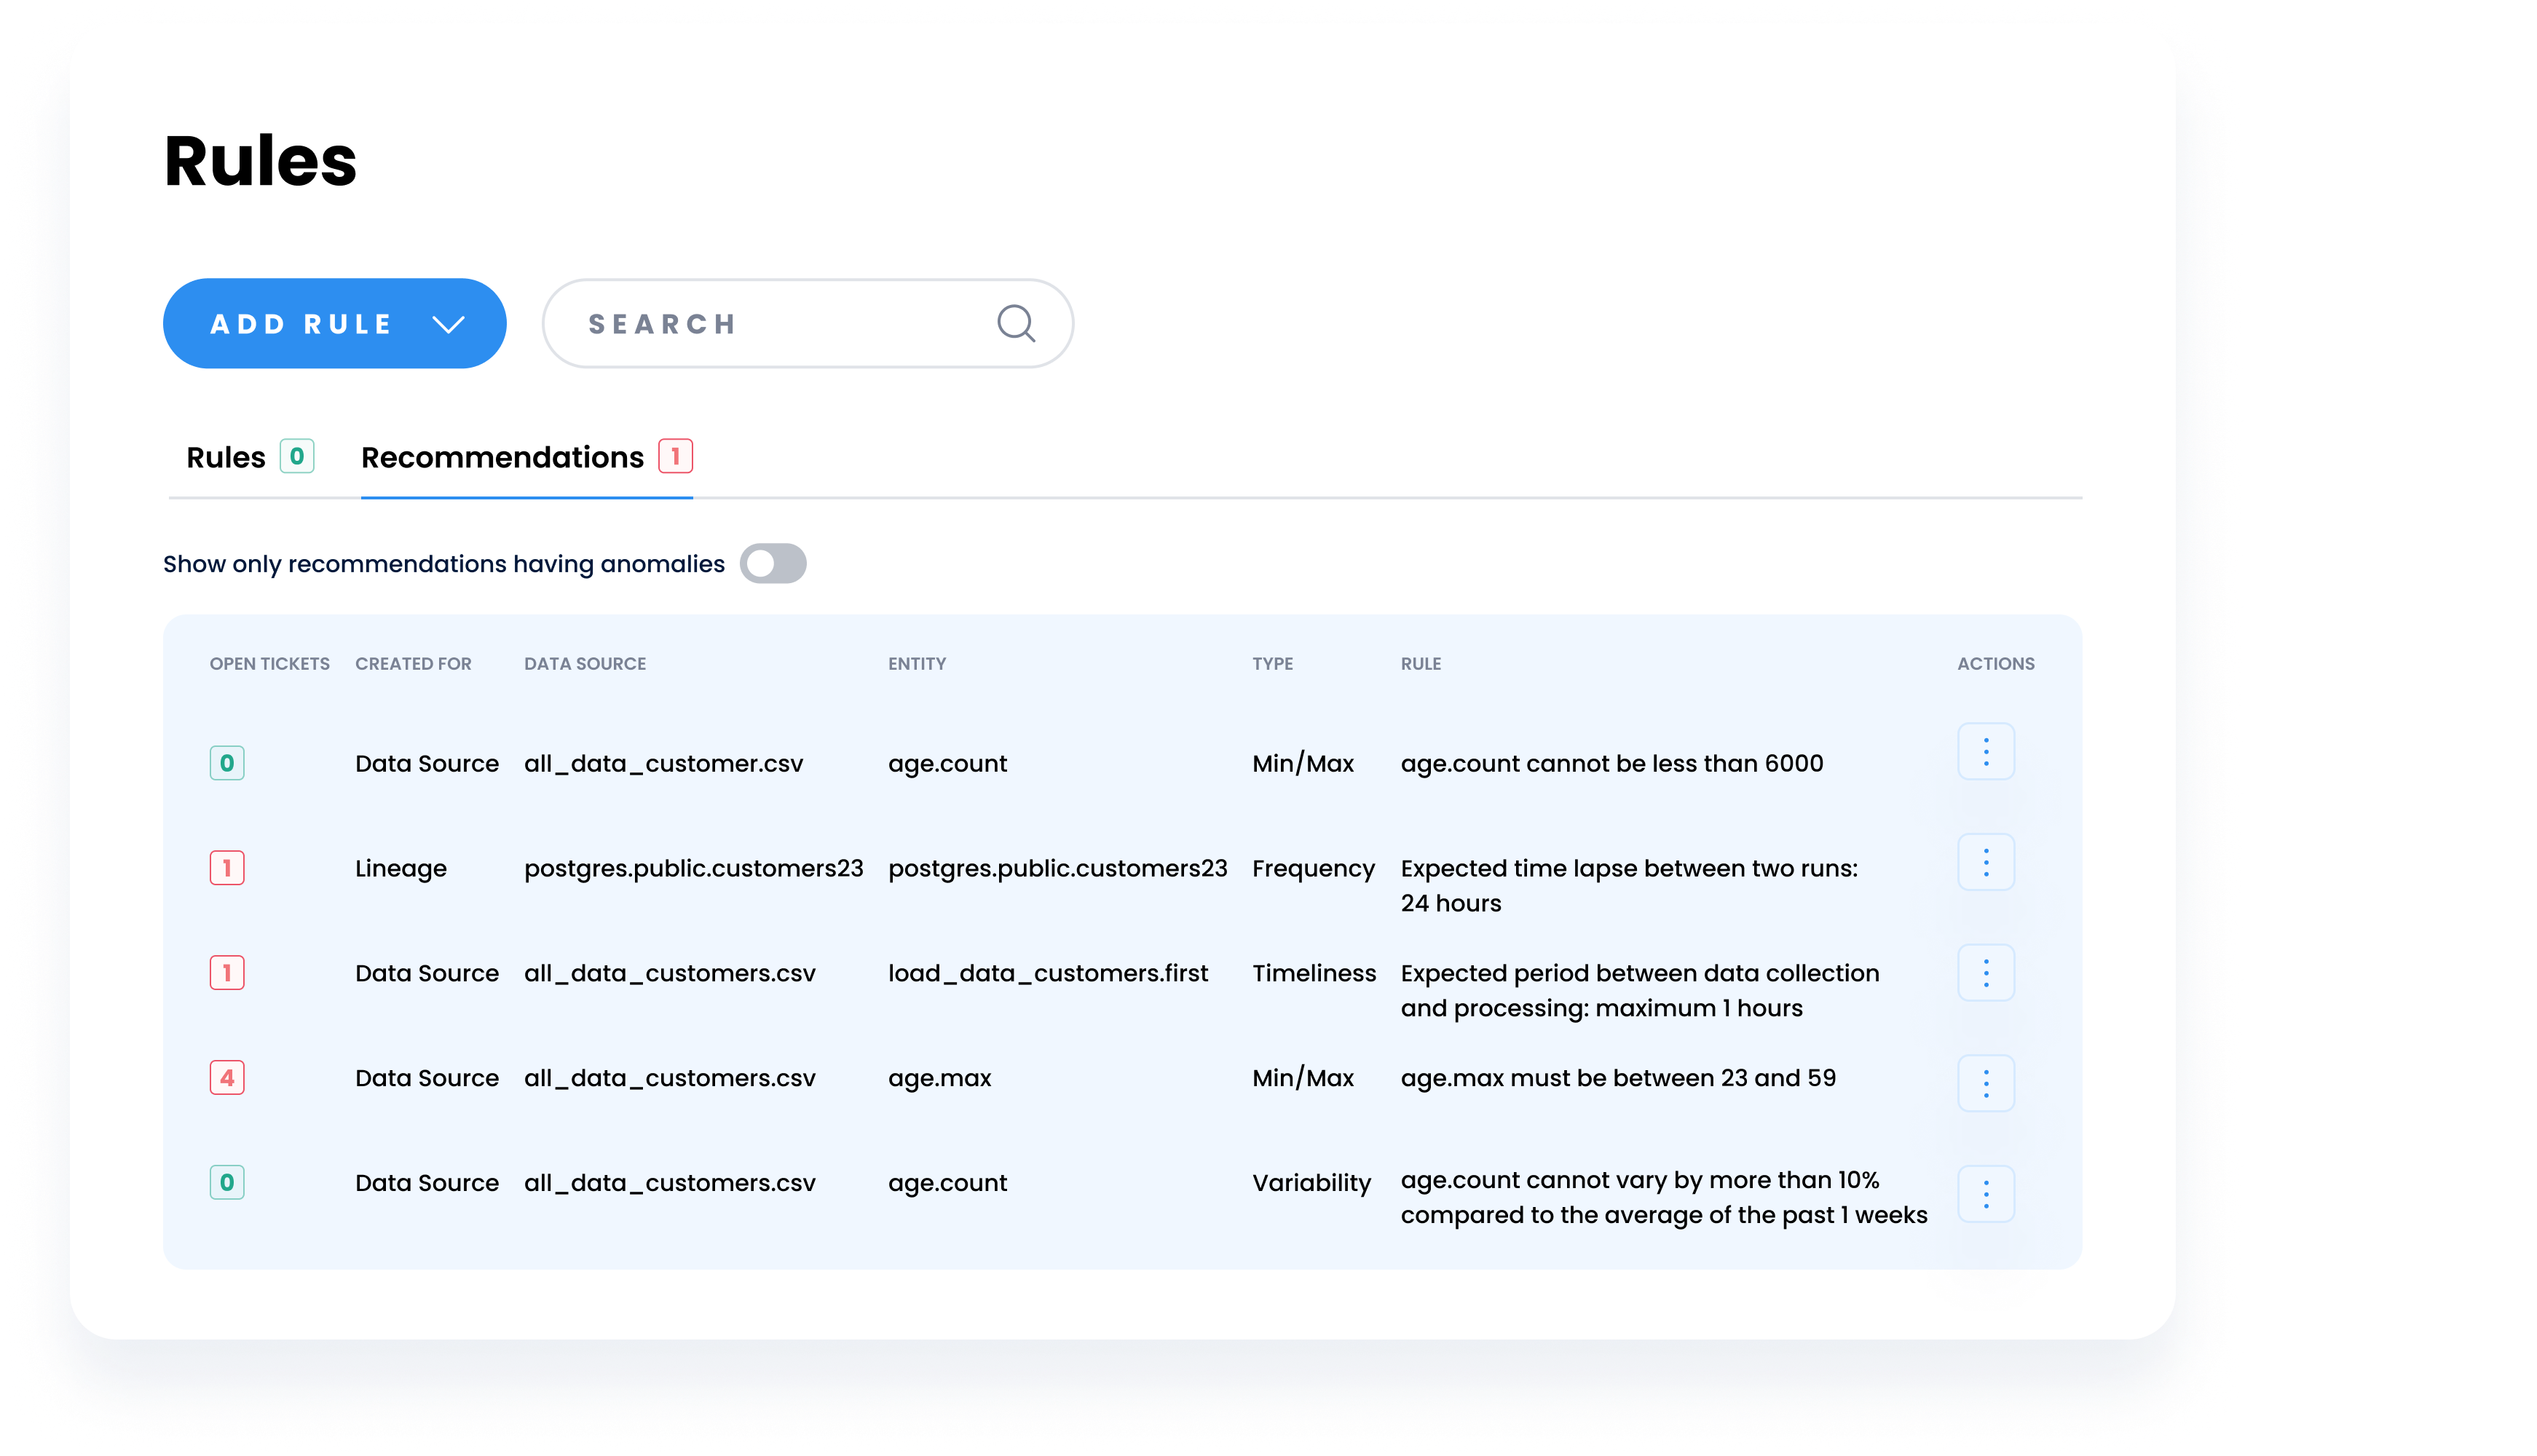
Kensu’s Profiler leverages insights about data at rest and in motion to recommend monitoring rules so you can accelerate the expansion of data observability coverage in minutes.
Kensu’s Agent Remote Controller lets you quickly configure the observability agents through a user-friendly interface without touching the application code base.
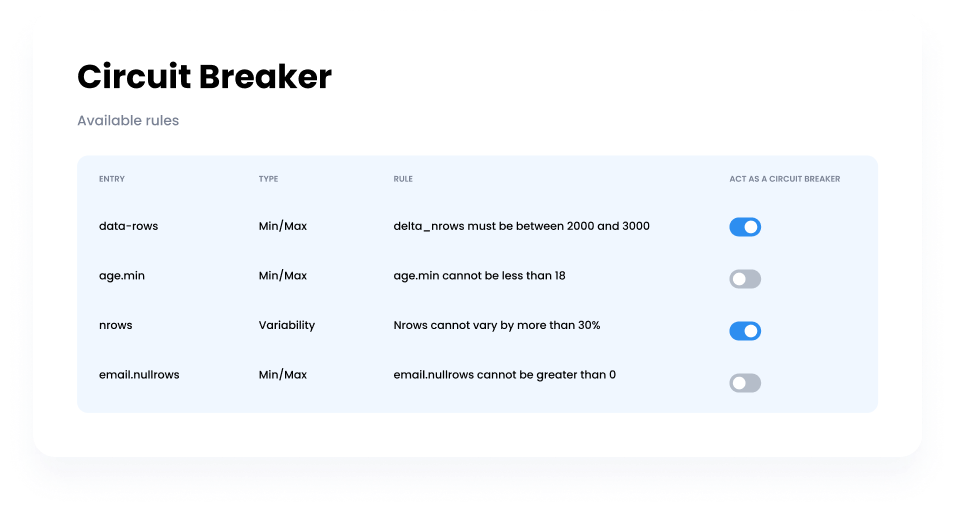
Kensu Circuit Breaker can require an application to stop working as soon as an incident has been detected, so you have time to solve the issue before it hits users.
Kensu Notifier sends an alert when a rule fails, while Kensu Tickets reveals the affected data source and what went wrong.
Kensu Explorer uses the data lineage to reveal the underlying causes of the issue, with detailed metrics on what’s changed in the affected data pipeline.
Kensu Observations illuminates the backstory behind the problem for every affected data source.
One solution for on-prem or cloud. Two lines of code to integrate. Three hours to initiate. Four weeks to scale.
Interested in learning more?