Kensu enhances dbt to help data teams with out-of-the-box data observability
In this article, we discuss how you can avoid data pipeline breakdowns thanks to total observability through the use of dbt complemented with Kensu.
Data quality problems tend to manifest in many ways. Here is an example.
Imagine the following situation. You have an important meeting with the planning department within the hour. As you reread the latest quarterly report, you realize that the figures reported don’t make sense. New categories of products appear in the `type` column, and the report seems to fail to take them into account when calculating the turnover. Until recently, that report had always been manually created and checked. But the latest one comes from an automated report generator. So, somewhere in the pipeline between the database and the report generator, the data is either corrupted or not processed correctly. Unfortunately, an hour is not enough to find the root causes of the problem, address them and then rerun the report generator!
Observability to the rescue
That problem could have been avoided if data observability had been implemented throughout the pipeline. Indeed, alerts would have been triggered, warning the pipeline stakeholders, for instance, data engineers, that an issue was detected
And even if a problem were to slip through the net, Kensu’s observability platform would allow data analysts and engineers to perform a systematic and effective root cause analysis. In such a context, detecting and solving data issues is straightforward.
Now, let’s dig deeper into how to reach full observability by complementing the use of dbt with Kensu.
dbt in a nutshell - transform, support and test
dbt stands for “data build tool” and performs the T in ELT (Extract, Load, Transform) processes. It consists of a toolset that simplifies the life of analytics engineers. It enables them to transform data in their warehouses simply with ‘SQL like’ SELECT statements that are then turned by dbt into tables and views. It is important to note that dbt does not extract nor load data. Instead, it transforms data that is already available in a warehouse. In short, dbt allows analysts to test data that is being transformed and thereby helps to set up software engineering standards within a data pipeline.
Underlying data of SQL databases are frequently changing. That is why, amongst other reasons, these databases can be challenging to test. dbt provides a way to improve the integrity of SQL in each model by making assertions about the results generated by the model. Ready-to-use dbt enables analysts to test whether a specified column in a model only contains:
- Non-null values
- Unique values
- Values that have a corresponding occurrence in another model (e.g., a customer_id for an order corresponds to an id in the model related to the customers)
- Values from a specified list
Further details about testing with dbt can be found here.
dbt natively supports connections to these data warehouses:
- Snowflake
- BigQuery
- Redshift
- Postgres
Note that there are also several community-supported adapters for other types of data warehouses.
A detailed description of dbt can be found here and in the dbt documentation.
Why integrate Kensu with dbt?
Our solution, Kensu, enhances the data lifecycle of dbt with its monitoring capabilities.
The integration of Kensu and dbt allows you to:
- Collect metadata from your dbt models
- Extract information like data lineage
- Obtain data source schemas
- Compute data metrics (e.g., max, min, mean, standard deviation, …)
Kensu complements the test capabilities of dbt thanks to monitoring and continuous validation enforced by internally defined rules. Moreover, our platform enables you to run custom tests in addition to those performed by dbt.
Succinctly, complementing dbt data pipelines with Kensu makes these pipelines observable.
If a data issue is automatically detected by Kensu or arises when reusing the dbt test, i.e., the test command of dbt, in production, our solution provides data observability. It radically facilitates the root cause analysis of the problem thanks to the three DODD principles:
- Contextual observability
- Synchronized observability
- Continuous validation
Let’s see what lies behind these concepts.
1. Contextual observability
A Kensu’s data observability agent is a small piece of Python code included in the dbt job, i.e., a set of commands written in Python to be run on a schedule. Our observability agents enable:
- The extraction of the execution context when data is processed in the pipeline
- The publishing of this information on Kensu’s platform
The observability information available on our platform can easily be used by data engineers or by any stakeholders to:
- Investigate and understand the data pipeline
- Debug or troubleshoot the data pipeline
- Perform root cause analysis on the data pipeline
Any of these three actions can be undertaken to solve the problem we mentioned at the beginning of this article, i.e., find why the automatically generated quarterly report is corrupted.
The easily accessible observability insights allow any technical team member to understand at a glance:
- Which data sources are transformed by the dbt pipeline
- What version was used to perform the transformation
- Which fields were processed during the transformation
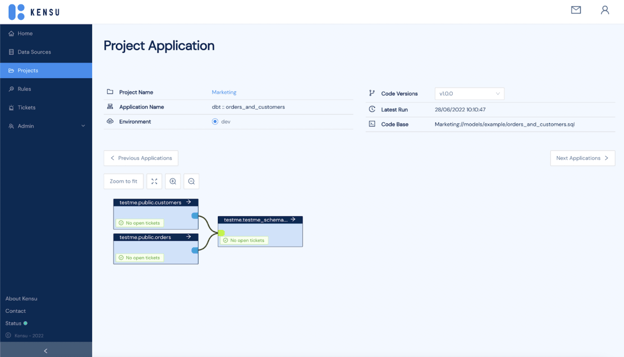
Caption: The figure above shows a view of the “Project Application” tab on Kensu’s platform. See core text for details.
The following contextual information is displayed on Kensu’s observability platform:
- The project name: in our example, the project is called ‘Marketing.’ This name was retrieved from the dbt project configuration
- The application name: the denomination of the dbt model
- The environment: in our example, the pipeline being monitored is in ‘dev,’ i.e., the development environment. If the production environment was monitored, it would read ‘prod’ or ‘live.
- The code versions: the different versions of the model
- The latest run: date (format: DD/MM/YYYY) and time (format: HH:MM:SS, 24-hour system) of the last time the code was executed
- The code base: the address of the source code of the dbt model
- The data lineage: the connections created by the different tables used in the dbt model
2. Synchronized observability
Each time the dbt run, i.e., the execution command of dbt, is invoked, the following observability information is sent to Kensu’s platform:
- The environment (DEV, UAT, PROD…)
- Data sources
- Data schemas
- Data lineage
- Details about the application, the code version, the code base, and the application name, which is also the dbt model name
- Statistical metrics on the data sources transformed by dbt such as max, min, mean, standard deviation
For this to happen, it does not require:
- Any external tools
- Any extra privileges
In short, no additional action or intervention is needed with our approach, as Kensu’s agents are embedded within the dbt Python code and hence have the same access privileges as the code itself. The simple integration of our observability agents within the dbt transformation setup automatically collects metadata from the transformation itself during each execution.
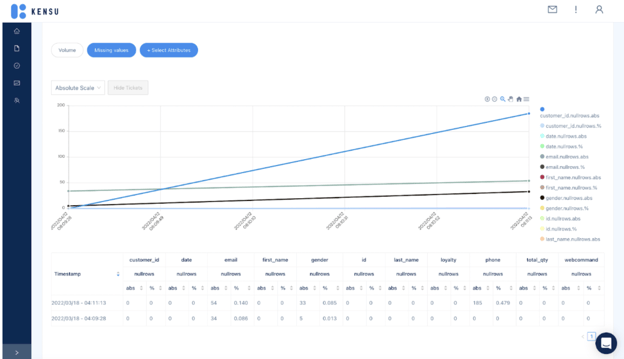
Caption: The figure above is an example of data statistics that can be found on Kensu’s platform. The displayed metrics have been collected from the dbt job. These metrics will show any data anomalies within the pipeline that will be specifically helpful when a root cause analysis is needed. Pipeline data metrics displaying no anomalies will give data consumers and engineers the confidence to trust the delivered information.
3. Continuous validation
Kensu’s agents extract the tests from the dbt projects and convert them into internal rules. Data teams can also monitor the tests in a production environment. If any test fails, Kensu will automatically create a ticket and dispatch an alert. That allows constant monitoring throughout the whole data lifecycle.
![]()
Caption: The figure above shows a rule that Kensu automatically created from the dbt run.
Kensu and dbt: a unique approach
The integration of our solution to the dbt pipeline is based on the open-source kensu-py library and the publicly-accessible dbt Python libraries.
All you have to do is add Kensu’s libraries, and you are done. These enhanced versions of the libraries will send the required observability information to Kensu’s database at run time. Our approach is unique as Kensu’s agents lie within the dbt Python code itself, as shown by the diagram below.
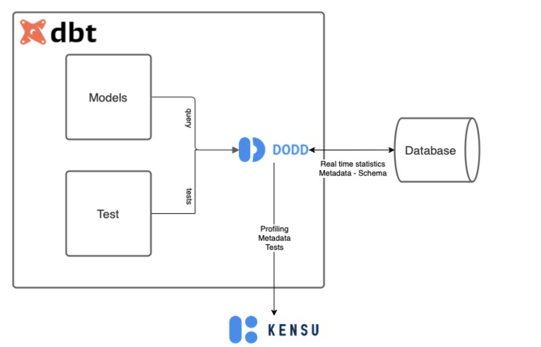
Caption: The figure above shows the integration of Kensu within the dbt pipeline itself. This approach is unique as Kensu’s agents are directly embedded in the dbt code. They allow the extraction of all the necessary information to make the dbt transformation pipeline completely observable.
The observability agents nested in the Kensu+dbt application will process the SQL queries to:
- Define the involved/relevant data sources
- Create the field-level lineage
- Compute statistics on the inputs and outputs of the lineage
- Extract the dbt tests
- Create the rules and associated alerts on our platform thanks to Kensu’s Expectation API
The Kensu+dbt integration makes it possible to investigate the root causes of any failing tests by using the end-to-end lineage and monitoring metrics that were collected.
These observability data are now available on Kensu’s platform. Therefore, the metadata can also be shared across the entire ecosystem of a company through Kensu's SDK. This integration allows data catalogs to always be up to date with respect to any of the dbt data transformations.
Summary
In this article, we discussed how you could avoid data pipeline breakdowns thanks to complete observability of that pipeline through the integration of our solution, Kensu, in dbt. Our unique approach consists in embedding Kensu’s observability agents directly in the dbt code. They enable the extraction of all the necessary information that will render the dbt transformation pipeline fully observable. It facilitates root cause analysis thanks to the three DODD principles: contextual observability, synchronized observability, and continuous validation. No external tools, actions, or interventions are required to obtain total observability. Only Kensu’s integration within dbt is necessary.
If you have any questions, suggestions, or want to try the new dbt integration, please contact us or connect to our Kensu Free Trial.