


Step 1
Set up your first project
Connect Kensu to your environment or use the default one, and get ready to discover its observability capabilities.
Step 2
Observe your first data pipeline

See how Kensu Explorer uses the data lineage to give you complete visibility over your pipelines.
Step 3
Create and break the rules
Discover how Kensu's Profiler leverages insights about data to recommend monitoring rules so you can accelerate the expansion of data observability coverage in minutes.
Step 4
Get your first ticket
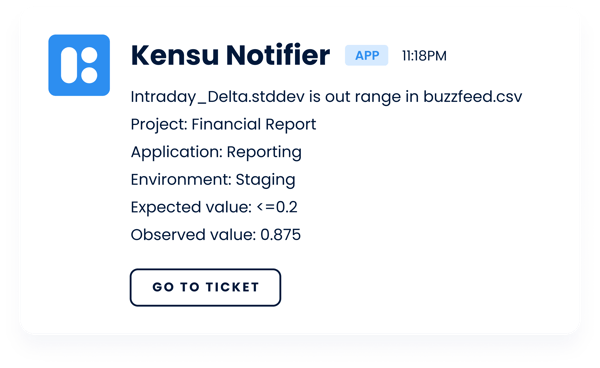
See how Kensu Notifier sends an alert when a rule fails, while Kensu Tickets reveals the affected data source and what went wrong.
Step 5
Prevent propagation

Set up Kensu Circuit Breaker, which is a proactive protection against propagating inaccurate or incomplete data, and see how you can prevent data incidents from impacting end-users.
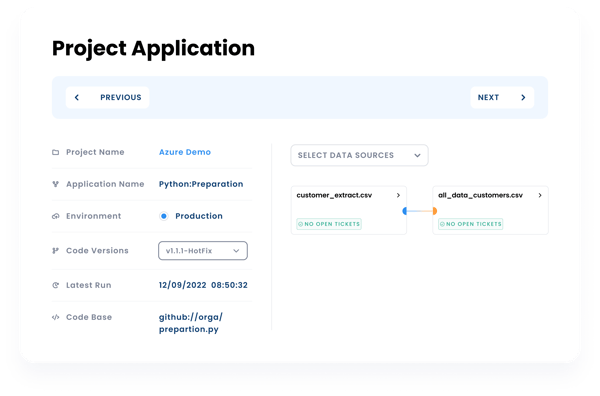
Step 1
Set up your first project
Connect Kensu to your environment or use the default one, and get ready to discover its observability capabilities.
Step 2
Observe your first data pipeline
See how Kensu Explorer uses the data lineage to give you complete visibility over your pipelines.
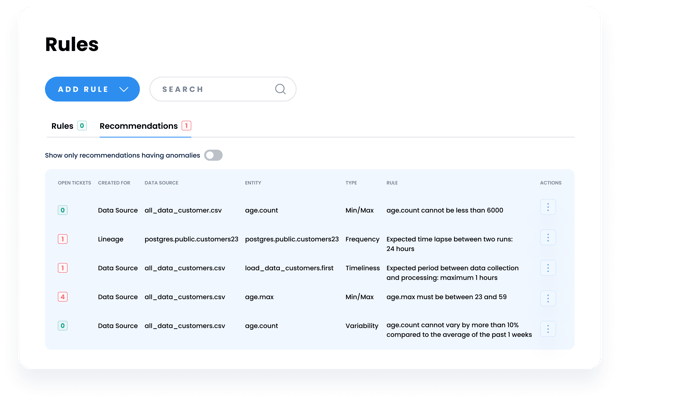
Step 3
Create and break the rules
Discover how Kensu's Profiler leverages insights about data to recommend monitoring rules so you can accelerate the expansion of data observability coverage in minutes.
Step 4
Get your first ticket
See how Kensu Notifier sends an alert when a rule fails, while Kensu Tickets reveals the affected data source and what went wrong.
Step 5
Prevent propagation
Set up Kensu Circuit Breaker, which is a proactive protection against propagating inaccurate or incomplete data, and see how you can prevent data incidents from impacting end-users.